Like on a plane, just with a lower carbon footprint
A good colleague - and most probably any geologist would concur - always used to design figures first, when writing about geology. The visual appeal of the discipline, and the geometric nature of mapping, fits with the approach, and helps the description, and narrative.
In this case what is depicted below is not such a visual thing in itself, nor there is much narrative: It is just a set of four exemplary time series I have been provided, containing data on Carbon Dioxide (proxy of room occupation/ventilation) concentration in parts per million (ppm), in different settings. In the graphs green, blue areas are supposed to be OK. Hatched orange and violet ones, not. The reference value for outside can be found here).
And yes, the following graphs were generated before the (little) text accompanying them.
On a flight Link to heading
It is not surprising that in a packed aircraft cabin many individuals breathe on each other (and/or cough, and/or sneeze), and carbon dioxide values get high, particularly in some phases (some are temporarily luckier, sometimes). When ventilation kicks in, and when HEPA filters are on, some help comes in. The undisclosed flight below reaches almost 2k ppm (see e.g. Nousaerons.fr for reference), while the - rather busy - terminals end up around 800-900 ppm. In this case we talk of old terminals that have been recently refitted (perhaps just aesthetically). For the very same airports, but inside newly built terminals, baseline values were measured around 500-600. In any case, the time series in figure 1 are self-explaining, Boarding and unboarding do not look particularly attractive, as expected.
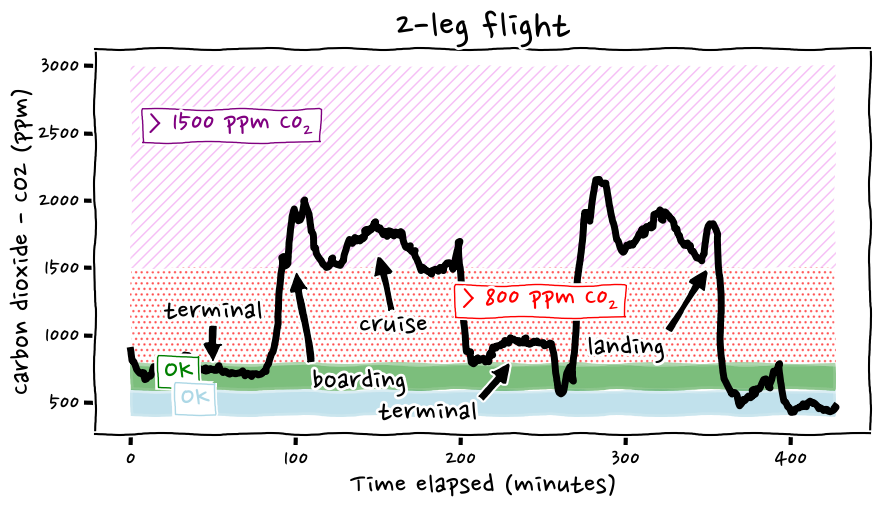 Figure 1: A plane journey in two legs.
(Almost) Like on a flight… Link to heading
The second example is from a building, of recent construction (4-5 years old, or so) with a medical practice hosted in it. Cool-seeming air pumped down the ceiling by air conditioning units, all windows closed, except for a very narrow opening (figure 2). I doubt that extra HEPA filters were integrated in the HVAC system, but it cannot be excluded.
Hand disinfectant bottles were apparently available, but no masks were worn. This brings up the fact that after amost 4 years indoor air quality is considered largely irrelevant, in many places. See also thread, in German.
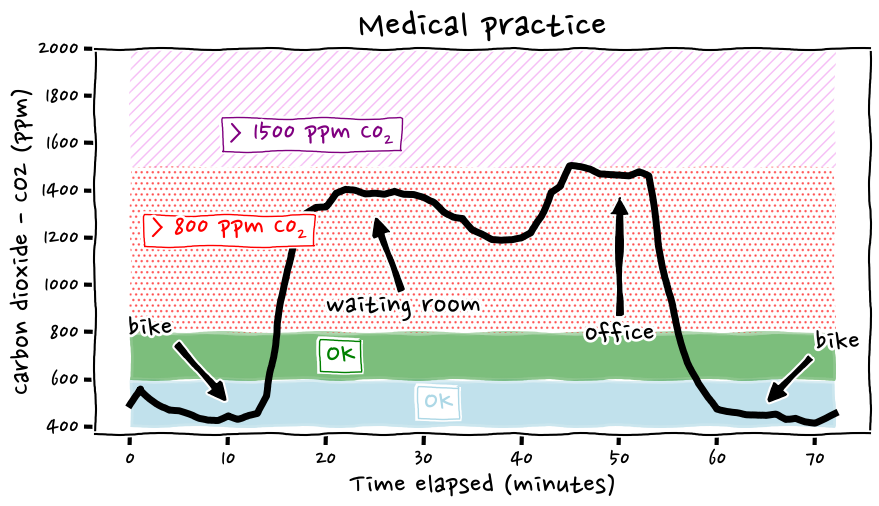 Figure 2: A medical practice. Please note the slow decay of CO2 on the first peak is due to a slightly open window. Being the only one open, not much air current/exchange was possible.
Nice surprises, sometimes Link to heading
Somewhat unexpected, as I recall anecdotes of 4-digits values in similar settings, figure 3 depicts the state of a modern, newly (heavily) refurbished indoor swimming pool. There is not so much to be commented, beyond a “wow, that’s pretty good!”. Of course anyone coughing on you at close range would not be a blessing. Overall it is impressive and would be, should there be an interest and market, something to advertise, and brag about. But there is no market to address, not many individuals interested, curious, nor concerned.
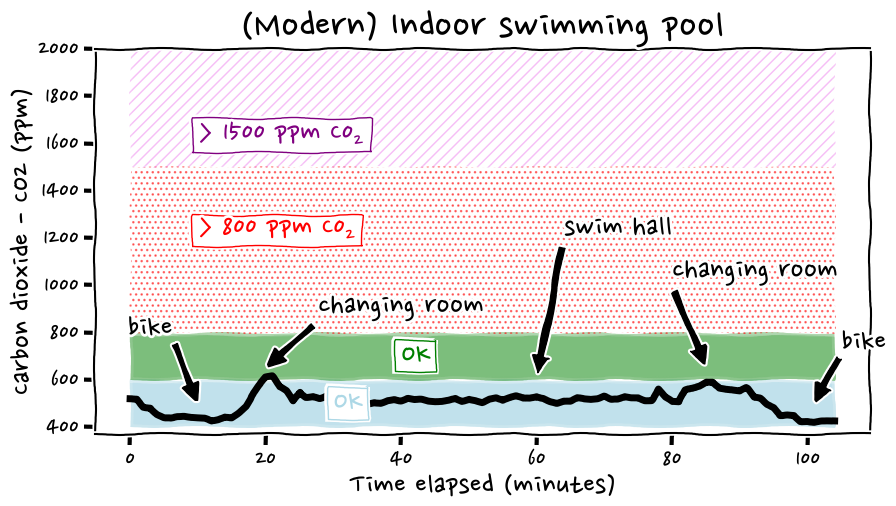 Figure 3: An exceptionally well-ventilated, newly built indoor swimming pool complex.
Yes, there was no dedicated HEPA (perhaps yes, integrated in the HVAC systems?), no CO2 display (they should have added it.As said, it would have been good advertisement material, just not many would look at it ;-/ ).
…And sub-optimal ones Link to heading
The last graph does not need much annotation. It is a large room, occupied for most of the day, presumably, and at some point with a resonably large group of individuals, none of which opened any window, before a minimal tilt-opening on both sides of the room was performed by an mildly horrified visitor (see figure 4).
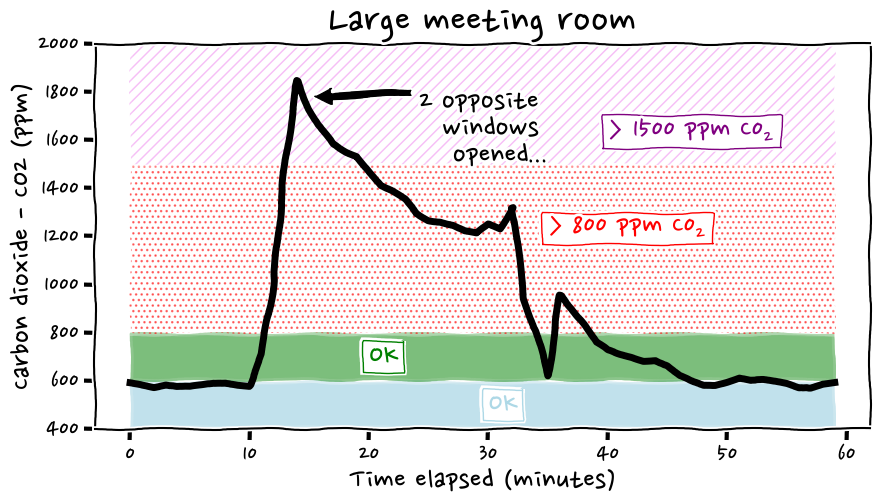 Figure 4: A large meeting room, that would have been OK-ish, should they properly opened (the abundant) windows. The opening mentioned in the annotation is just partial, and with a packed room. The rate of decay is in fact not so high, like some 600 ppm in 20 minutes, or so.
So what? Link to heading
The examples provided above have no claim of completeness, representativeness. Perhaps few places are not too horrendous, such as possibly few of the schools still having a proper window opening protocol, or hosted in a well ventilated building. Yet not many collect and release such data. Some do, though: See https://bostonschoolsiaq.terrabase.com.
But at the end of the day, one cannot predict how bad it will be inside a certain building or room. Few positive suprises might come up (Figure 3), but one should mostly expect bad ones, even in the cases where it would be technically possible to have some decent ventilation. Where available, windows could be opened, yet someone has to do it. This is likely due to lack of information (in 2023… sigh), and perhaps also linked to denial, and behavioural deficits of (all of?) the command chain: From those setting policies, rules, to those implemeting them, those supposed ot check them, up to those (un)willingly not opening a couple of windows, or so.
Funnily (pre-SARS) regulations see 1-2k ppm CO2 as too much already. But if one does not measure, no data exist, there is nothing to worry about.
If you happen to use devices such as Aranet 4, and want to make similar plots, feel free to make use of this gist (please note that with newer version of pandas one might need to slightly change it).
Bonus quiz Link to heading
What is this (figure 5)? Feel free to drop me an email with your interpretation.
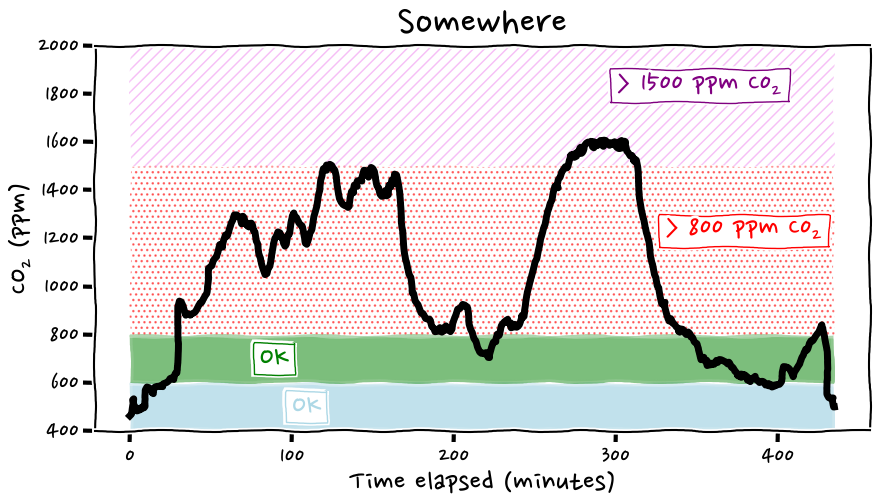 Figure 5:: no_caption.
Acknowledgements Link to heading
Thanks to FI, XR.
References Link to heading
Useful, and not necessarily quoted in the text. Again, it is not a paper.
https://doi.org/10.1128%2Fmsphere.00086-22
https://www.nature.com/articles/d41586-023-00642-9
https://www.ncbi.nlm.nih.gov/pmc/articles/PMC8248566/
https://www.ncbi.nlm.nih.gov/pmc/articles/PMC10090298/
https://doi.org/10.3389/fpubh.2022.1087087