One Lustro later

One Lustro ( /ˈlus.tro/ ), i.e. some 5 years. Half a decade.
A light beer Link to heading
The best marketing a pandemic, or virus, ever had (for free): SARS/SARS-Cov-2 changes names to Covid and, at least in Germany, to Corona, i.e. a light Mexican beer one sips with lime.
It turns out we all are somewhat impervious to communication, to connect basic facts with perception, versus reality.
Few things that did not make it to common knowledge, for example:
- SARS is not good for you1. Even without browsing almost 5 × 10⁵ papers2.
- SARS can leave 1 out of 20 or more, of those catching it, with Long Covid (LC). At each round. As per WHO tweet3, but that is perhaps even too optimistic, see further below.
- Most mitigations are NOT freedom restrictions (e.g. through awareness and attention, care for indoor air quality: You can jump below). This is the most unhelpful misconception.
Yes, the first violent pandemic in a real-time connected, networked, global-cheap-airfare world was a shock. And that shock resulted in denial, rather than awareness, or, at least, little fixes applied to the systems that actually made it happen.
Oops… Long Covid? Link to heading
So, no, it is not a cold. But (scientific) literature is not among coffee reading. Now, assuming that 1 out of 20, or to be a bit more precise 6 out of 100 according to WHO, which I bet is a tiny bit too optimistic (just peek into e.g. Porter et al., 2024. or Qin et al., 2024): What does that mean? You can click and play with the plot below.
Assumptions and Limitations:
- The little interactive toy model below assumes each infection carries an independent risk of developing long COVID. but it lets you explore higher/lower risk through time
- The model doesn’t consider varying severity of infections or individual risk factors
Moreover:
- Long COVID can present itself with varying severity and duration
- Long COVID has not really had a cure, thus far. On top of the fact that even if there will be, eventually, things broken on the way might not get fixed (e.g. things such as those described by Moen et al. 2025).
It would be helpful to raise a little awareness, without being scaremongers. D. Steadson4 looong time ago did this already, but that was perhaps a bit too pessimistic. Or maybe not?
Please note stuff might be much worse than just this 6% (the ballpark of above quoted Porter et al., 2024. or Qin et al., 2024 does seem to suggest some more sobering figures).
This toy model calculator also accounts for Long Covid risk to decrease upon subsequent reinfections. The model can behave more conservatively than just assuming independent equal risk per infection. Risk may decrease (factor < 1.0) due to some immune protection, or increase (factor > 1.0) due to cumulative damage. It also lets you play with different scenarios.
Again, it’s a toy. Is the risk independent, or not? Is it decreasing? Time will tell… With our skin in the(ir) game.
Now, the above is very simplistic (see below for details). Just:
This is for example much better: https://www.peertopublic.com/tools/long-covid-forecast as well as the essay attached to it https://www.peertopublic.com/posts/understanding-cumulative-risk
How much does this cost? Or, better said, the continued denial of this: How much does that cost? D. Paessler and colleagues calculated5 it ( Daniell et al., 2025 , see also Paessler et al., 2025), at least for Germany: 60B EUR per year.
Clean air - what’s that? Link to heading
So, if there is one — ONE — thing that out of the past Lustro had to be done, was to promote awareness on indoor clean air. Yes, many parts of the world have far worse problems to handle than just clean air, but still, getting more often, more sick, won’t help anyone.
I wrote about this earlier. It did not get through (for me, and for many others). Again, impervious.
What — I think — is lacking is both (practical) guidance, and good (practical) examples. In fact, even if some examples exist, if they are too far (geographically or community-wise, e.g. Japanese restaurants vs. German schools), they are probably not perceived as relevant. There is an additional aspect to it: The tick-mark attitude, i.e., considering only official guidelines or communications from official channels. This is most probably a dominant effect for medical doctors, school leadership, corporate middle management, and so on. Such mindset is — I bet — widespread, and might act as an anti-stress, delegating reasoning, and fact-checking, to a level above.
Anyway, if anybody wants to give me a hand in documenting any virtuous examples in schools, administrations, businesses, please feel free to reach out, or head to: https://github.com/aprossi/awesome-clean-air-practice.
Can this be improved? Yes. A good first step would be to still use — for those who had them — CO2 monitoring, or air filters (in certain places in Germany, e.g. Münster, they trashed thousands of them after “the end of the pandemic”. Elsewhere they are simply unused). Is it new information? No, see e.g. Curtius et al., 2021. Would this appeal to other spaces beyond schools? Yep, see e.g. Agius, 2025.
Is there hope? Little, but some: E.g., see what A. Wünsch made: https://indoorco2map.com/. I quote it, as it contains in concise form what actually is the gist of the problem:
The goal of the Indoor CO2 map is to create a free and comprehensive crowdsourced dataset about CO2 levels in all kinds of non-residential buildings, i.e. shops, hospitals, cinemas and many more. The concentration of CO2 levels is in most settings a reliable indicator for the share of exhaled air, that is air which has been exhaled by persons. A higher concentration correlates with a higher risk of inhaling aerosols containing infectious agents. By collecting these data, people who want to reduce their risk of infections can make informed decisions about their everyday choices. If the amount of measurements becomes high enough it might also serve as data source or starting point for scientific analysis.
Last time I asked locally, few years back, about something similar, I was answered with a supercazzola6
Washing hands Link to heading
Medical doctors — and in general medicine — should make peace with natural sciences (I bet apart from cultural aspects, curricula really might have some deficit). Natural sciences, and engineering, in general, should perhaps communicate more than just to promote results of a certain group, department, institute via science communication. Not all is like that. There are efforts7, but ignored by most.
As much as there is (motivated) obsession with cleaning surfaces (have you ever seen how they clean hospital floors?), airborne mitigation seems to be the devil (also cognitively) for most. But maybe they could give a call to Haddrell et al. (2024), for example.
Back at the end of 2023 I tried to convey the message8, but — again — nope. Perhaps they can directly read Jimenez et al. (2022).
Still, some/many blame it all to lockdowns, e.g. pieces on BBC9. One really wonders why (again, see e.g., among many, Moen et al. 2025)…
If you prefer something handy to be printed, here it goes:
And yes:
Yet, we have it and we all have to live with the consequences, whether we are aware, or not.
There is some hope. Just, things go (very) slow. The hope is more osmosis for information across discipline silos. Seems obvious with so much online, connected knowledge around, but it is not.
Talking about slowness… John Snow10 is famous for having resolved a cholera epidemic in London in 1854 after having - through geospatial analysis ante litteram - removed an infectious water pump handle in Soho, thus conclusively proving that cholera is waterborne. Just… It took 21 years for this idea to become enshrined in any sort of real regulatory implementation, i.e., the public health act of 1875 11 (A. R. Milne, pers. comm.).
Thus, if medical doctors, or school leaders, would talk to — say — aerosol scientists, or engineers a bit more, that would help. They could also perhaps start e.g. looking at:
https://letsair.org/#mediation
And maybe not wait 21 years.

Long COVID Risk Toy Models Link to heading
Basic Parameters Link to heading
- p = risk per initial infection (e.g., 0.06 for 6%)
- λ = infections per year (e.g., 1.0)
- t = time in years
- n(t) = total number of infections at time t
- d = decay factor for reinfection risk (e.g., 0.5 for 50% reduction per reinfection)
Total infections at time t: $$n(t) = \lambda \times t$$
Example: With $\lambda = 1$ infection/year after $t = 5$ years: $$n(5) = 1 \times 5 = 5 \text{ infections}$$
Model 1: Independent Risk (simplistic model) Link to heading
Assumption: Each infection carries the same independent risk p
Probability of NO long COVID after n infections: $$P_{\text{ind}}(\text{no long COVID}) = (1 - p)^{n(t)} = (1 - p)^{\lambda t}$$
Cumulative risk of long COVID: $$P_{\text{ind}}(\text{long COVID}) = 1 - (1 - p)^{\lambda t}$$
Worked Example (independent model) Link to heading
With $p = 0.06$ (6% risk per infection) and $\lambda = 1$ infection/year:
- After 1 year: $P = 1 - (0.94)^1 = 6.00%$
- After 5 years: $P = 1 - (0.94)^5 = 26.61%$
- After 10 years: $P = 1 - (0.94)^{10} = 46.14%$
Model 2: Decreasing risk model Link to heading
Assumption: Each subsequent infection carries reduced risk based on decay factor d
Risk for infection i: $$p_i = p \times d^{i-1}$$
Where:
- $p_1 = p$ (first infection has full risk)
- $p_2 = p \times d$ (second infection has reduced risk)
- $p_3 = p \times d^2$ (third infection has further reduced risk)
- etc.
Probability of NO long COVID after n infections: $$P_{\text{dec}}(\text{no long COVID}) = \prod_{i=1}^{n} (1 - p_i) = \prod_{i=1}^{n} (1 - p \times d^{i-1})$$
Cumulative risk of long COVID: $$P_{\text{dec}}(\text{long COVID}) = 1 - \prod_{i=1}^{n} (1 - p \times d^{i-1})$$
Worked Example (decreasing risk model) Link to heading
With $p = 0.06$, $d = 0.5$, and $\lambda = 1$ infection/year:
After 5 years (5 infections):
- Infection 1: risk = $0.06 \times 0.5^0 = 0.06$ (6.0%)
- Infection 2: risk = $0.06 \times 0.5^1 = 0.03$ (3.0%)
- Infection 3: risk = $0.06 \times 0.5^2 = 0.015$ (1.5%)
- Infection 4: risk = $0.06 \times 0.5^3 = 0.0075$ (0.75%)
- Infection 5: risk = $0.06 \times 0.5^4 = 0.00375$ (0.375%)
$$P_{\text{dec}}(\text{no long COVID}) = (1-0.06) \times (1-0.03) \times (1-0.015) \times (1-0.0075) \times (1-0.00375)$$ $$= 0.94 \times 0.97 \times 0.985 \times 0.9925 \times 0.99625 = 0.8938 = 89.38\%$$
$$P_{\text{dec}}(\text{long COVID}) = 1 - 0.8938 = 0.1062 = 10.62\%$$
Comparison after 10 years:
- Independent Model: $P = 1 - (0.94)^{10} = 46.14\%$
- Decreasing Risk Model (d=0.5): $P ≈ 9.4\%$
Model comparison Link to heading
| Time | Independent Risk | Decreasing Risk (d=0.5) | Reduction Factor |
|---|---|---|---|
| 1 year | 6.0% | 6.0% | 1.0× |
| 5 years | 26.6% | 10.6% | 2.5× |
| 10 years | 46.1% | 9.4% | 4.9× |
Research basis Link to heading
The decreasing risk model aligns with e.g.:
- E.g. Bosworth et al. (2023): “Risk of new-onset long COVID after a second SARS-CoV-2 infection is lower than that after a first infection”
- E.g. Carazo et al. (2025): Long COVID risk fell from ~15-17% (first infection) to ~6% and ~5% (subsequent reinfections)
Typical decay factors:
- d = 0.33 (reinfections have 1/3 the risk)
- d = 0.5 (reinfections have 1/2 the risk)
- d = 0.7 (reinfections have 70% of previous risk)
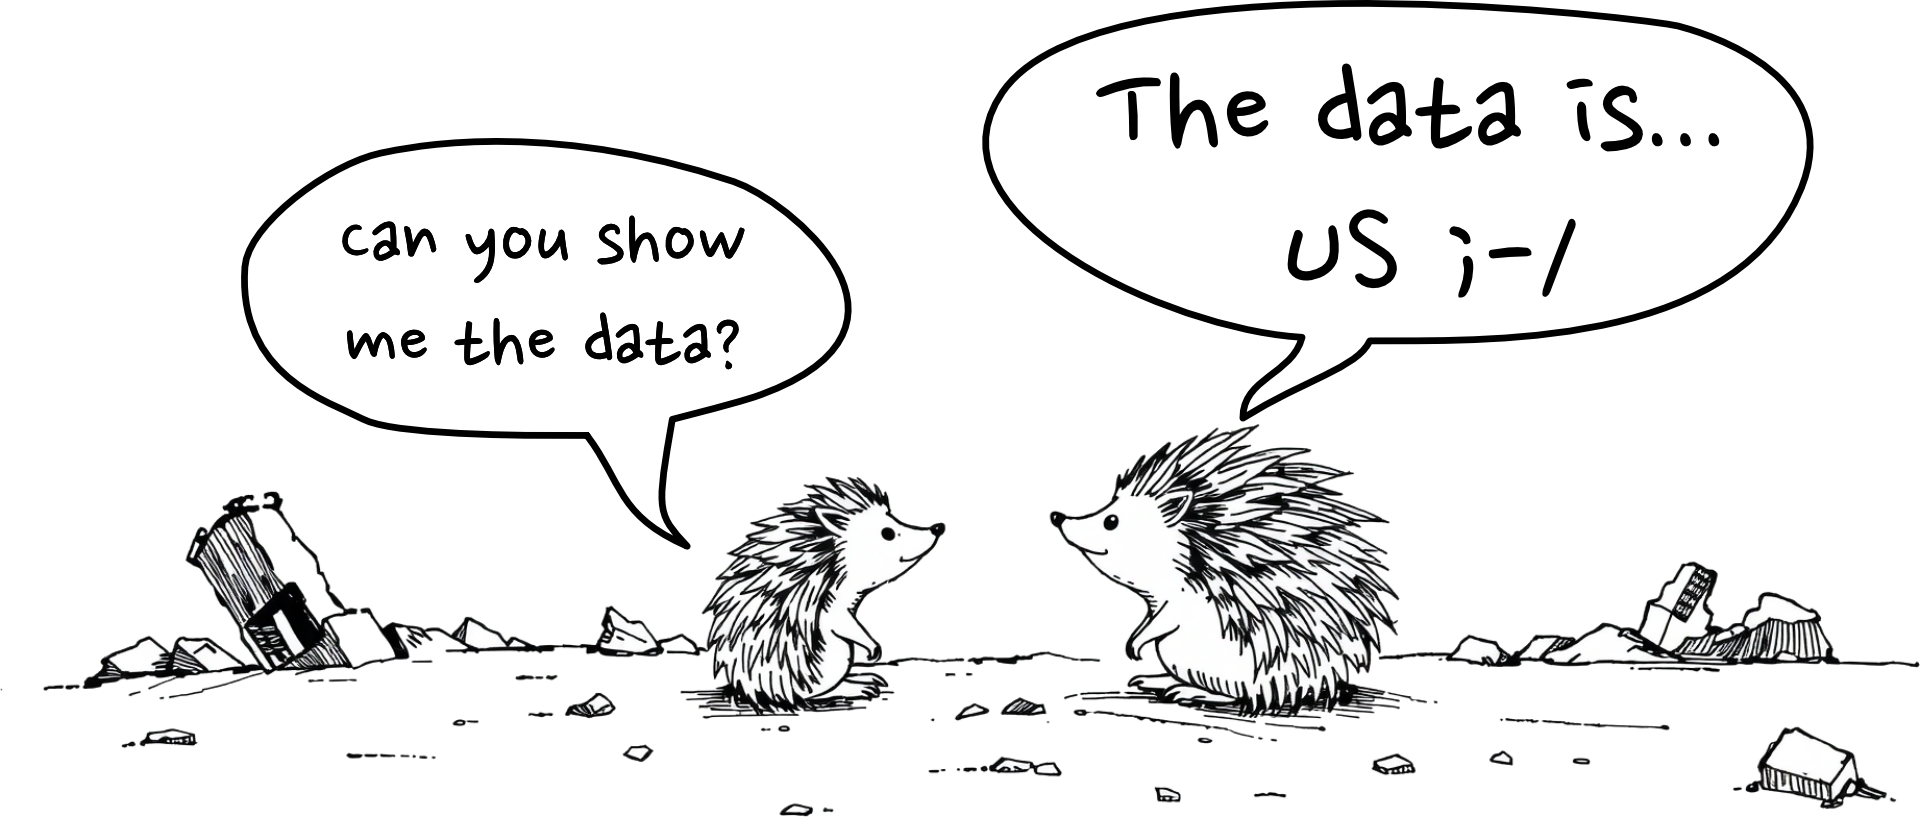
There are also evidences such as those in Openshaw et al. (2025). One can get back to the first pair of hedgehogs above.
Mathematical Principles Link to heading
This calculator uses principles from:
- Geometric probability for modeling repeated trials
- Independent events (Model 1) vs dependent events (Model 2)
- Complement probability using P(long COVID) = 1 - P(no long COVID)
- Product probability for calculating cumulative no-risk probability
Acknowledgements Link to heading
Thanks to the Internet Archive, and G. B. Piranesi for the banner image. Thanks for comments to VB, SVG, ARM.
References / notes Link to heading
Agius, R. M. (2025) A better approach to mitigate the risk of airborne infections in workplaces. Occupational Medicine, 75(1), 1–3. https://doi.org/10.1093/occmed/kqae083.
Bosworth, M. L., Shenhuy, B., Walker, A. S., Nafilyan, V., Alwan, N. A., O’Hara, M. E., & Ayoubkhani, D. (2023) Risk of New-Onset Long COVID Following Reinfection With Severe Acute Respiratory Syndrome Coronavirus 2: A Community-Based Cohort Study. Open Forum Infectious Diseases, 10(11), https://doi.org/10.1093/ofid/ofad493.
Daniell J, Brand J, Paessler D, Heydecke J, Schoening S, McLennan A. K. (2025) The rising cost of Long COVID and ME/CFS in Germany. Hamburg and Karlsruhe: ME/CFS Research Foundation and Risklayer. link to full text.
Carazo, S., Ouakki, M., Nicolakakis, N., Falcone, E. L., Skowronski, D. M., Durand, M.-J., Coutu, M.-F., Décary, S., Dialahy, I. Z., Drescher, O., Canitrot, E., McGinn, C. A., Latouche, P., Laforce, R., Dallaire, C., Denis, G., Piché, A., & Serres, G. D. (2025). Long COVID risk and severity after COVID-19 infections and reinfections in Quebec healthcare workers (p. 2025.05.08.25327059). medRxiv. https://doi.org/10.1101/2025.05.08.25327059.
Curtius, J., Granzin ,M., & and Schrod, J. (2021) Testing mobile air purifiers in a school classroom: Reducing the airborne transmission risk for SARS-CoV-2. Aerosol Science and Technology, 55(5), 586–599. https://doi.org/10.1080/02786826.2021.1877257.
Jimenez, J. L., Marr, L. C., Randall, K., Ewing, E. T., Tufekci, Z., Greenhalgh, T., Tellier, R., Tang, J. W., Li, Y., Morawska, L., Mesiano-Crookston, J., Fisman, D., Hegarty, O., Dancer, S. J., Bluyssen, P. M., Buonanno, G., Loomans, M. G. L. C., Bahnfleth, W. P., Yao, M., … Prather, K. A. (2022) What were the historical reasons for the resistance to recognizing airborne transmission during the COVID-19 pandemic? Indoor Air, 32(8), e13070. https://doi.org/10.1111/ina.13070.
Haddrell, A., Oswin, H., Otero-Fernandez, M., Robinson, J. F., Cogan, T., Alexander, R., Mann, J. F. S., Hill, D., Finn, A., Davidson, A. D., & Reid, J. P. (2024) Ambient carbon dioxide concentration correlates with SARS-CoV-2 aerostability and infection risk. Nature Communications, 15(1), 3487. https://doi.org/10.1038/s41467-024-47777-5.
Moen, J. K., Baker, C. A., & Iwasaki, A. (2025). Neuroimmune pathophysiology of long COVID. Psychiatry and Clinical Neurosciences. https://doi.org/10.1111/pcn.138555.
Openshaw, J. J., Chen, J., Rodriguez, R., Gottlieb, M., McCullough, K., Santangelo, M., Hill, M. J., Gatling, K., Idris, A. H., McDonald, S., Wisk, L. E., Dyal, J., Wang, R. C., Rising, K. L., Kean, E., O’Laughlin, K. N., Stephens, K. A., Malicki, C., Lin, Z., … for the Innovative Support for Patients with SARS-CoV-2 Infections Registry (INSPIRE) Group. (2025). The Effect of Severe Acute Respiratory Syndrome Coronavirus 2 (SARS-CoV-2) Reinfection on Long-Term Symptoms in the Innovative Support for Patients With SARS-CoV-2 Infections Registry (INSPIRE). Clinical Infectious Diseases, https://doi.org/10.1093/cid/ciaf225.
Paessler, D., Hechler, M., Verbeek, R., Neefischer, S., & Dormann, H. (2025). Modellierung der COVID-Infektionszahlen in Deutschland (2020–2024). Notfall + Rettungsmedizin, 28(3), 165–170. https://doi.org/10.1007/s10049-025-01520-9.
Porter, C. K., Beckett, C. G., Cooper, E., White, L., Wallace, D., Jakubski, S., Boulifard, D., Schilling, M., Sun, P., Marayag, J., Marrone, A., Nunez-Hernandez, E. O., Vangeti, S., Miller, C., Ge, Y., Ramos, I., Goforth, C., Sealfon, S. C., & Letizia, A. G. (2024) Clinical and functional assessment of SARS-CoV-2 sequelae among young marines – a panel study. The Lancet Regional Health – Americas, 39. https://doi.org/10.1016/j.lana.2024.100909.
Qin, S., Zhang, Y., Li, Y., Huang, L., Yang, T., Si, J., Wang, L., Zhao, X., Ma, X., & Gao, G. F. (2024) Long COVID facts and findings: A large-scale online survey in 74,075 Chinese participants. The Lancet Regional Health – Western Pacific, 52. https://doi.org/10.1016/j.lanwpc.2024.101218.
-
https://www.ncbi.nlm.nih.gov/research/coronavirus/ (who knows how long this lasts online…) ↩︎
-
https://twitter.com/DavidSteadson/status/1546308765171224576 ↩︎
-
https://twitter.com/arosp/status/1677405065361997826. To be fair, the English wikipedia page is deficient, it is better to consult the Italian version: https://it.wikipedia.org/wiki/Supercazzola. ↩︎
-
https://www.nsysu.edu.tw/p/406-1000-276509,r3244.php?Lang=en ↩︎
-
https://www.bbc.com/future/article/20250605-the-pandemic-generation-how-covid-19-has-left-a-long-term-mark-on-children ↩︎
-
e.g. https://johnsnow.matrix.msu.edu/work.php/id=15-78-52/ ↩︎